


What's Your LinkedIn Impact Score?
How to better understand the impact you're making on LinkedIn


Periodically, I get emails from LinkedIn (LI) informing me that people are viewing my profile. And that’s great. I’m an analytics-driven fractional CMO, and that’s my language. But lately, I’ve been thinking about those emails, which now raise more questions than answers. For example:
How many people in my network see my posts?
Do the people viewing my profile have an interest in working with me?
How does my LinkedIn activity compare to others with similar goals?
What can I do to gain more visibility?
These are essential questions for anyone in sales, marketing, or a leadership role who spends time on LinkedIn to network and create opportunities.
As I mentioned in a prior post, “Is Your MVP Sitting on the Bench,” building your network is the most essential activity you can do daily. And it’s the only activity that guarantees a return on your time investment. This is really important stuff.
Before writing this post, I didn’t know how to answer those questions. And LinkedIn doesn’t make it easy to answer all of them. So, I started digging into LinkedIn analytics and 3rd party tools to help me find some answers. What I discovered led me to create my “LinkedIn Impact Score” and a better way to measure progress on the platform.
Here’s what I found and how you can apply the same approach to understand better how well your LinkedIn activity works for you …
Pretty Damn Average
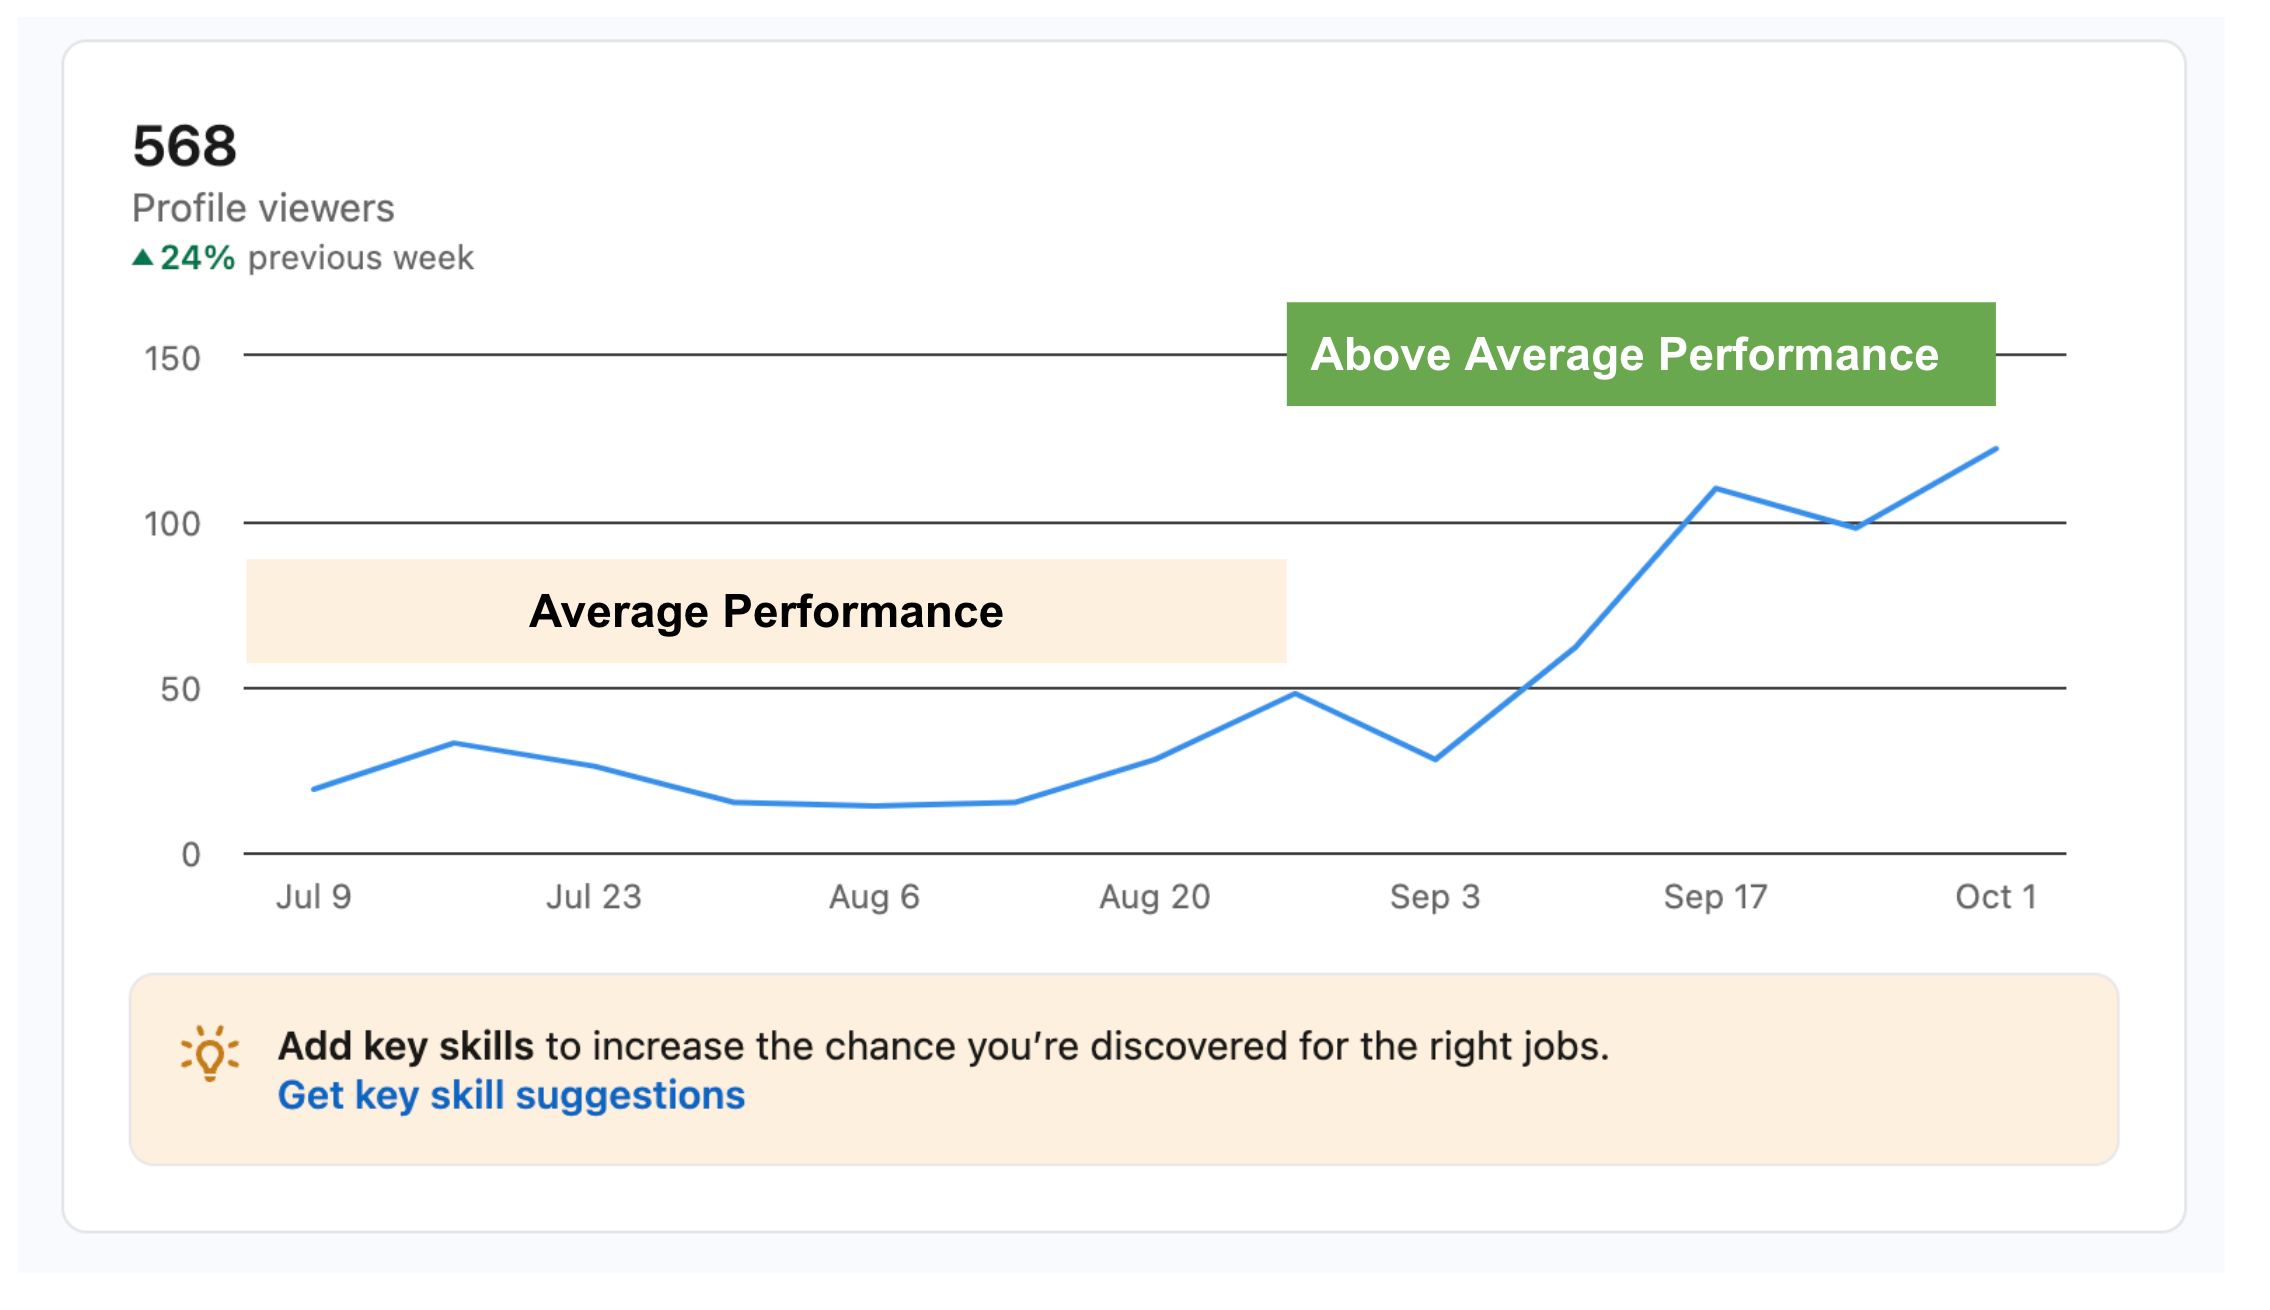
Before September of 2023, my profile view activity wasn’t very good. It was pretty damn average compared to others with similar roles, backgrounds, and years in the industry. Looking at the past 90 days, I received 568 profile views on LinkedIn.
What Does Your Score Look Like?
You can find some basic information when you click on your profile image on the LinkedIn home page and scroll to the Analytics section. This is a good starting point.
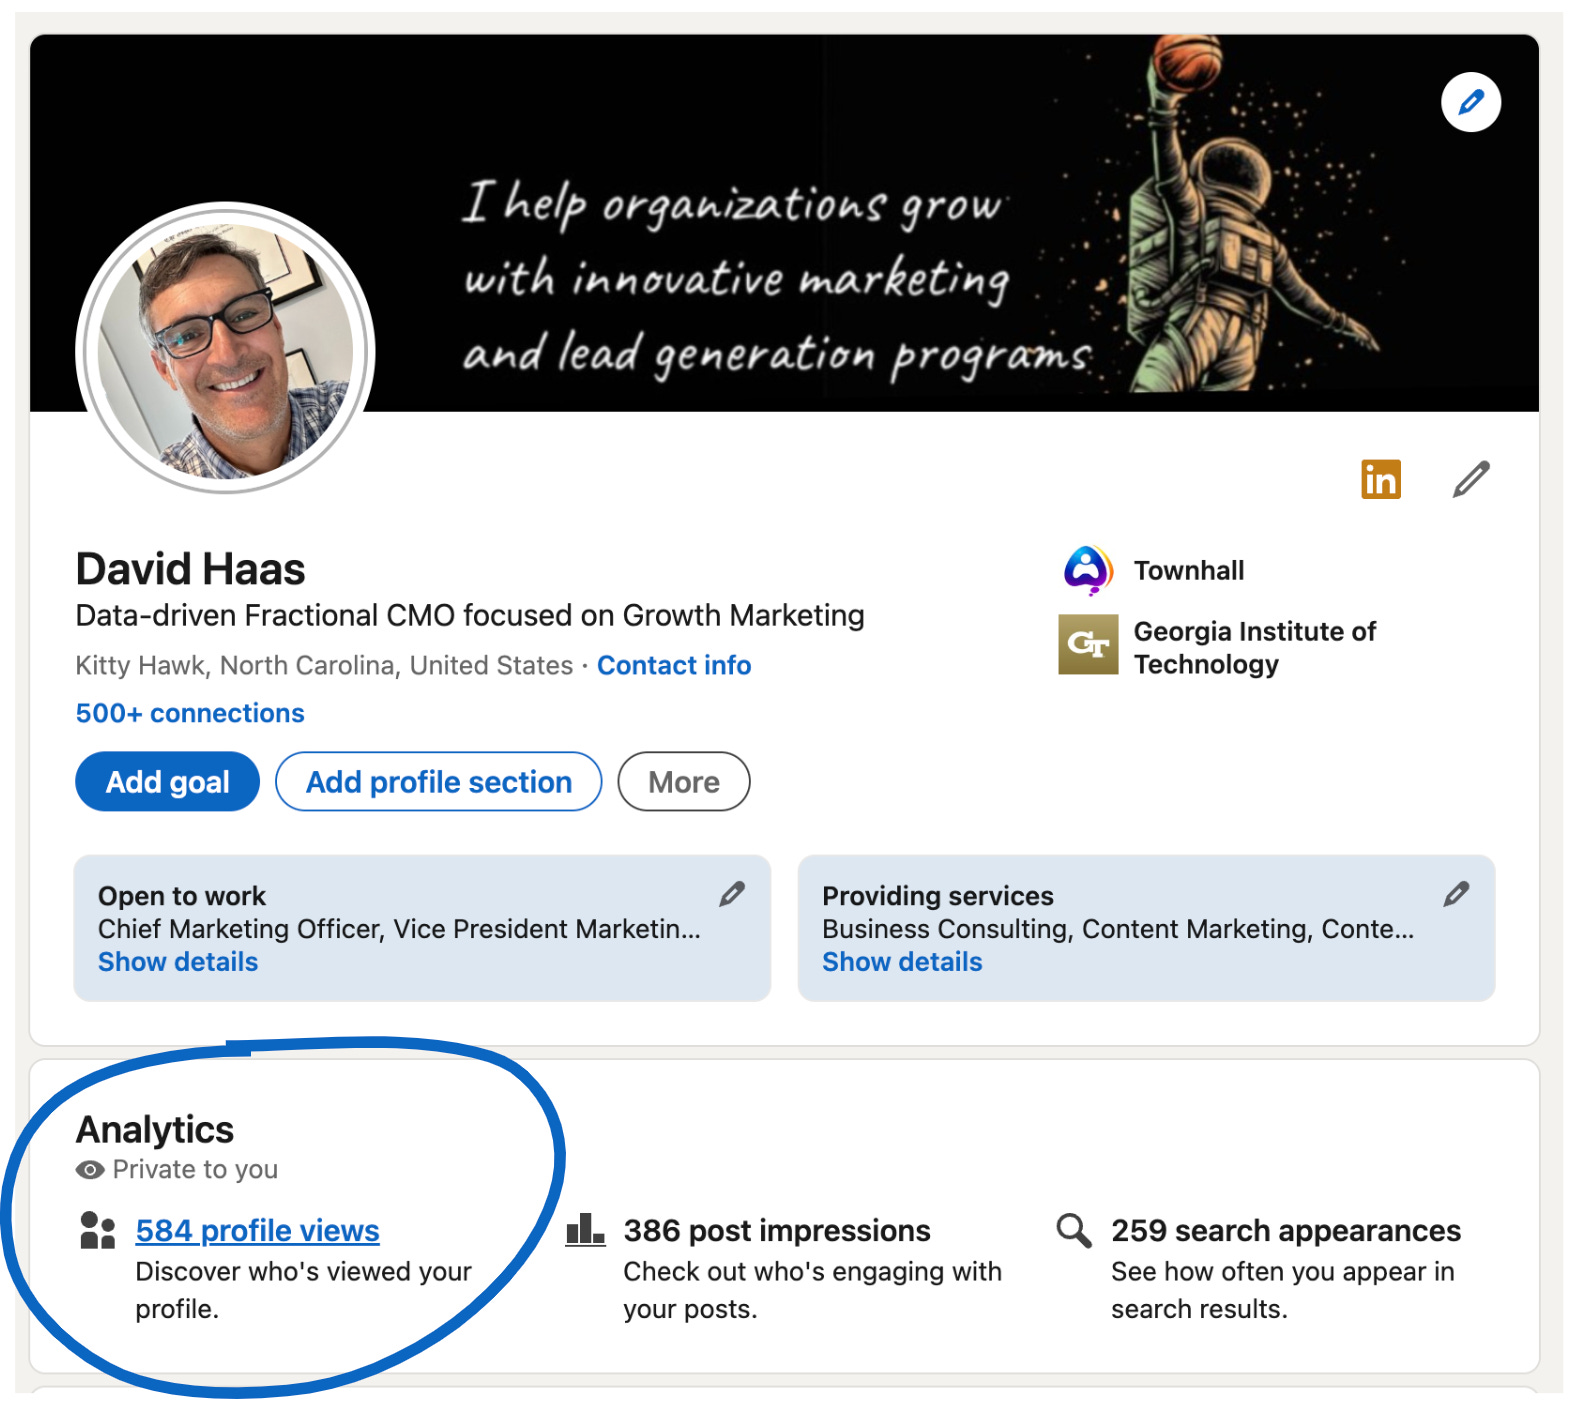
By clicking on Profile views, you can gain insight into a partial list of the people who have viewed your profile recently (LinkedIn Premium users receive a more comprehensive list).
NOTE: LinkedIn recently changed my Analytics section and placed it at the top of my profile page in a section called, “Analytics & tools.” If you don’t see yours, try looking at the top:

This exercise helped me establish a baseline for my LinkedIn activity. However, it didn’t help me understand how to improve it, which posts were getting the most traction, and what I should start doing more (and less) of. So here’s what I did …
What’s Working for You?
While LinkedIn gives you post-by-post analytics, comparing your post performance without a third-party automation tool like Hootsuite that tracks this data isn't easy. If you don’t have an automation tool, you could consider tracking it manually, but that’s a lot of tedious work.

I took a slightly different approach. Some LinkedIn web scraping tools allow you to grab your profile's analytics and those from other LinkedIn profiles. I like this approach as it lets you see what others are doing and learn from them. I used PhantomBuster to generate a table containing all the data from my LinkedIn post activity. You can check it out here to get a closer look.

I now have data on each Post's Likes, Comments, and Reposts. I’m specifically interested in “Actions” and “Awareness” that result from my Posts. I define “Actions” as the combination of the unweighted sum of Likes, Comments, and Reposts - what my audience is doing with my content on LinkedIn.
I define “Awareness” as the total number of Views a post gets on LinkedIn. This is an interesting metric to track because LinkedIn's algorithm shows you which posts are favored more, which decides when and where to place your posts in your audience’s feed. For Awareness, I used the “viewCount” metric already provided by LinkedIn. I sorted them from highest to lowest view count to gain perspective on the best-performing posts. I’ll introduce how I create the “LI Impact Score” in the next section of this post.
Here’s what I learned from this exercise:
The Posts with content that I wrote performed best. Yes, you need to write your content occasionally versus sharing content others write. For tips on writing great content, check out last week’s article, “How I Leverage AI to Write Content That Doesn't Suck.”
The Posts with interesting pictures performed better than those with “stock photos.” One of my posts, which contained no new content but had a good image, is one of my top performers. Creativity doesn’t have to mean writing; just putting some thought into your post goes a long way.
Sharing your content on appropriate LinkedIn Groups boosted several of my posts. However, it’s interesting to note the same content posted to other Groups did not perform as well. It’s helpful to track this and determine which Groups are best suited for what you post.
Posts that announce a new job or promotion always seem to perform well. For me, announcing new fractional engagements is probably something that I’ll do from now on.
As you gain more data points, use this exercise to determine what topics to write on next.
My biggest takeaway from this analysis is to post original, great content more often and share it with Groups that value your voice. No small task, but at least I have a strategy now.
Your LinkedIn Impact Score
I created a “LinkedIn Impact Score” to help me understand, week to week, how my LinkedIn activity is progressing. There is no “good” or “bad” number. I’m simply using an easy method to see how my score moves from week to week. I weigh each metric and sum them to create the score.

Here’s how I weight each metric:
Views = 1 point
Likes = 5 points
Comment = 10 points
Repost = 20 points
Comments and Reposts are critical as they result in more views and visits to my site. Your weighting might be different based on your goals.
Note: LinkedIn has a Social Selling Index (SSI) score, which I discovered while researching for this article. While attractive, it does not provide the detail required to shape your activity week to week. You can learn more about it here to explore it further.
Be a Spy
Some might call this lurking, but it’s not that creepy. If someone is killing it on LinkedIn, you should check out what they’re doing. It’s not a silver bullet for success, but it is helpful. You can learn how often they post, what they post, and what works best for them.
So, I pointed my PhantomBuster scraper toward a few content authors I admire to learn more about what’s working for them. Here’s what I gained from this exercise:
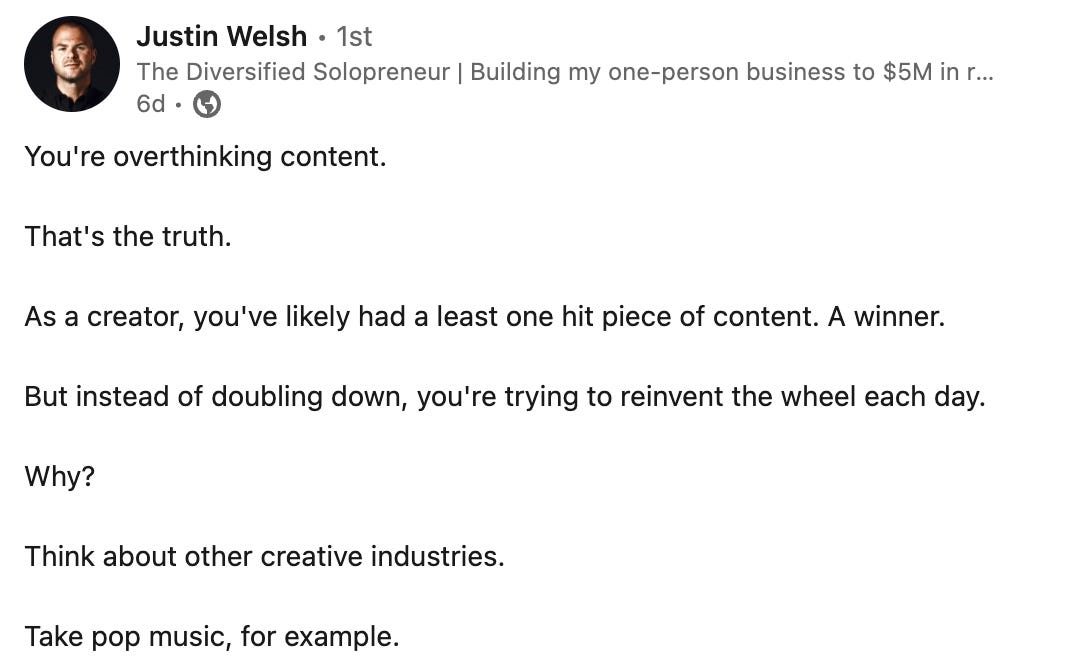
Many of the top-performing folks repurpose their best content. Justin Welsch, who writes about solopreneurship, sums it up well here.
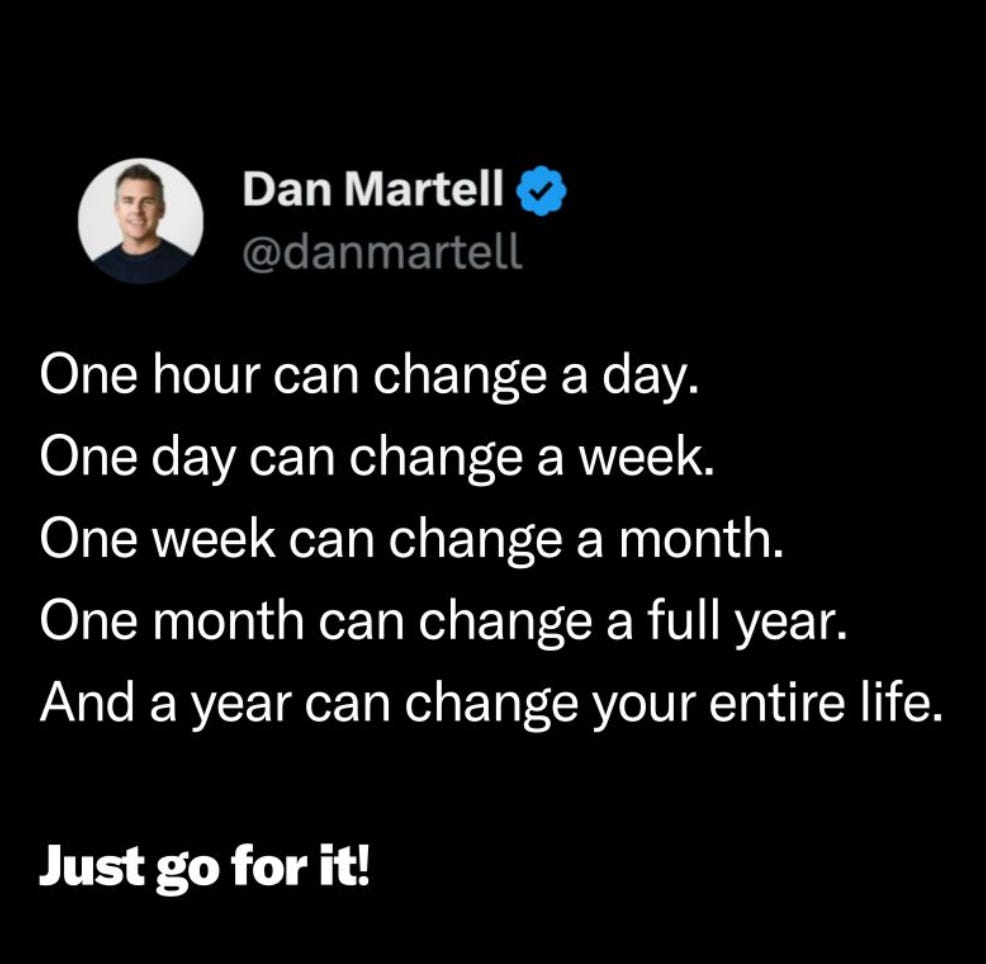
They post every day. That feels like a lot of content, but many posts are not attached to articles and share a viewpoint. Dan Martell, who writes for SaaS founders, does this well.
They have great points to make and often do it without many words
They stay in their lane. Each of the authors that I follow has a consistent voice. I know that their content will likely be helpful for me, and they cover a topic I’m interested in learning about.
It took a long time. Most of the authors I follow have spent years getting the followings they have. It doesn’t seem to happen overnight.


One last thought: be careful not to compare your scores directly with those you follow. It’s all about increasing your LinkedIn Impact Score, not trying to beat someone else. Play your own game. Your content is likely different, your audience is different, and your point of view is different. Don’t play someone else’s game; learn from what others are doing.
Reach out if you’d like assistance optimizing your LinkedIn impact. I’m a data-driven fractional CMO focusing on growth marketing and go-to-market activations, including Content Development, Email Campaigns, Social automation, CRM Optimization, and Analytics.